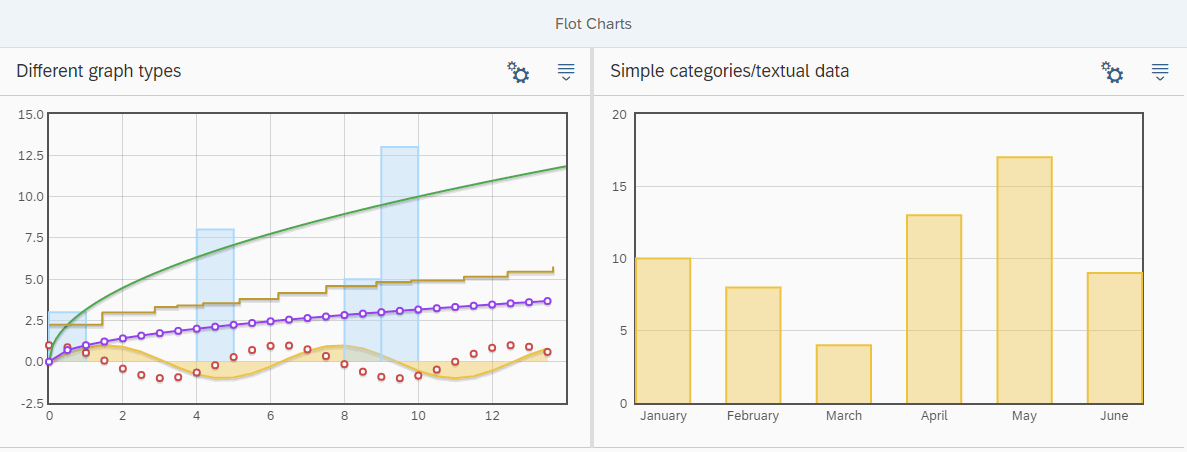
There are a couple of open-source projects out there, that aim to integrate a third-party charting library into OpenUI5. They provide wrapper-controls, that attempt to let the developer access the chart API in UI5-manner. This means, you get native UI5 controls, that can be configured as usually from views and controllers, but use the external visualization library under the hood to output the desired chart. This gives you nice view syntax and a feeling of not leaving the safe haven of UI5. But this approach has significant drawbacks:
- You are bound to a specific charting library and mostly even to the specific version, that is supported by the wrapper.
- You introduce not only a dependency to a (hopefully stable and well supported) charting library, but also to the corresponding UI5-wrapper.
- You still need to learn the API of the charting library to be able to configure your controls, but this learing gets more complicated as native docs and tutorials need to be adapted to the UI5-style API syntax.
Personally, I feel more comfortable, using a charting library of my choice directly. Luckily, there is a very easy way to do it in OpenUI5. If the visualization library is compatible with jQuery or plain vanilla JS, we can use a simple sap.ui.core.HTML control to render a container-div, initialize our chart from the controller and place it within that container. Since the container is represented by a regular UI5 control, we can now wrap a panel around it, which will give us a toolbar, collapsible behavior and many mor goodies!
Here is an example for such a chart panel in an XML view using the well known Flot library based on jQuery. Note, that the HTML for container-div must contain encoded HTML entities!
<mvc:View controllerName="sap.m.sample.Flot.Flot" xmlns:mvc="sap.ui.core.mvc" xmlns:core="sap.ui.core" xmlns="sap.m"> <Panel width="100%" height="400px"> <layoutData><l:SplitterLayoutData size="50%" /></layoutData> <headerToolbar> <Toolbar height="3rem"> <Title text="Different graph types"/> <ToolbarSpacer /> <Button icon="sap-icon://settings" /> <Button icon="sap-icon://drop-down-list" /> </Toolbar> </headerToolbar> <content> <core:HTML afterRendering="onChart1Init" content='<div id="chart1" style="height: 100%; overflow: hidden; position: relative;"><h4></div>'> </core:HTML> </content> </Panel> </mvc:View>
Now, all the charting logic needs to be placed in the onChart1Init event handler in the controller, like this:
sap.ui.define([
		'jquery.sap.global',
		'sap/ui/core/mvc/Controller',
	], function(jQuery, Controller, JSONModel) {
	"use strict";

	var FlotController = Controller.extend("sap.m.sample.Flot.Flot", {
		onInit : function (evt) {
			// Init-logic for regular controls goes here, but not for our chart
		},
		onChart1Init : function(oEvent) {
			setTimeout(function(){
				// Start Flot example from http://www.flotcharts.org/flot/examples/categories/index.html
				var data = [ ["January", 10], ["February", 8], ["March", 4], ["April", 13], ["May", 17], ["June", 9] ];

				$.plot("#chart1", [ data ], {
					series: {
						bars: {
							show: true,
							barWidth: 0.6,
							align: "center"
						}
					},
					xaxis: {
						mode: "categories",
						tickLength: 0
					}
				});
				// End Flot example
			}, 0);
		}
	});
	return FlotController;
});
Wrapping chart initialization into setTimeout() makes sure, the container had been completely rendered before the chart is plotted.
All that's left is to include the library source code in our app. Either simply add the following lines to the index.html below (!) the UI5 bootstrap or follow my guide to include third-party libraries in UI5 apps the clean launchpad-friendly way.
<script id="sap-ui-bootstrap" ...></script>
<script language="javascript" type="text/javascript" src="flot/jquery.flot.min.js"></script>
<script language="javascript" type="text/javascript" src="flot/jquery.flot.categories.js"></script>
<script language="javascript" type="text/javascript" src="flot/jquery.flot.resize.js"></script>
That's it! This method will work with any jQuery-compatible charting library.


